 Acad
AcadAdministrative Boundary Map Generator for Research Maps
An administrative boundary map generator lets you fetch official country, state, district and sub-district boundaries by name and style them for publication — without hunting down shapefiles. AcadGIS pulls those boundaries from GADM in a few lines of Python and hands you a clean, plottable layer.
What an administrative boundary map generator does (and why researchers need one)
An administrative boundary map generator turns the name of a place and an administrative level into a styled map of its official boundaries — countries, states or provinces, districts, and sub-districts. For a researcher, that removes the most tedious part of making a study-area figure: tracking down the right shapefile, confirming its vintage, unzipping it, reprojecting it, and cleaning inconsistent attribute names.
Most papers, theses and grant reports need at least one boundary map: a country context panel, a district-level base for a choropleth map generator, or a clean administrative frame around your sampling sites. AcadGIS treats boundaries as a first-class input — you request them by name, and the geometry, projection and naming are handled for you, so the same code reproduces the figure months later.
Fetch boundaries by name from GADM — no shapefile hunting
The core function is load_boundaries(). You pass a country name and a level, and AcadGIS returns a GeoDataFrame of that level's polygons. Levels include country, state (province), district, division and upazila (sub-district), mapping onto GADM's administrative hierarchy.
Boundaries are sourced from GADM, the Database of Global Administrative Areas, and cached locally after first use so your figures stay reproducible offline. Bangladesh, Iraq, India and the USA are bundled and work without any download; every other country is fetched by name on demand. No portal logins, no wrong-year files, no manual reprojection.
Make one in Python
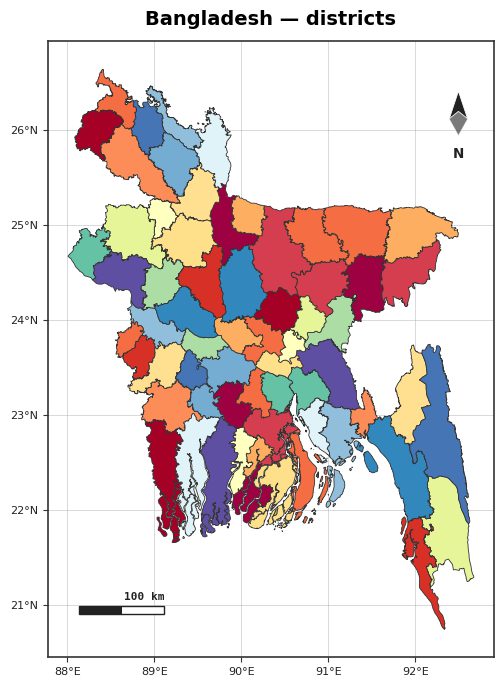
A complete district-level administrative map is a two-step job: load the boundaries, then plot them. The plot() call applies the academic theme and adds a north arrow, scale bar, title and legend by default, so the output is ready to drop into a manuscript.
To draw the districts of a single state or division, pass a parent region to within= so only that subset is returned. That is the fastest route to a focused base map for a field campaign or a regional study.
import acadgis as agis
districts = agis.load_boundaries("Bangladesh", level="district")
agis.plot(districts, theme="academic", title="Districts of Bangladesh")
agis.save("bd_districts.png", dpi=300)
Highlight a region and subset by parent
To emphasise one unit — a study division, a focal province — load the level you want and pass its name to highlight= in plot(). AcadGIS shades that polygon distinctly while keeping the others as context. This is ideal for the orientation panel of a study area map generator figure.
The within= argument also nests: ask for the upazilas within a single division, or the districts within one state, and you get exactly that slice — no post-hoc filtering of a national file.
import acadgis as agis
divs = agis.load_boundaries("Bangladesh", level="division")
agis.plot(divs, highlight="Dhaka", theme="academic",
          title="Study region: Dhaka Division")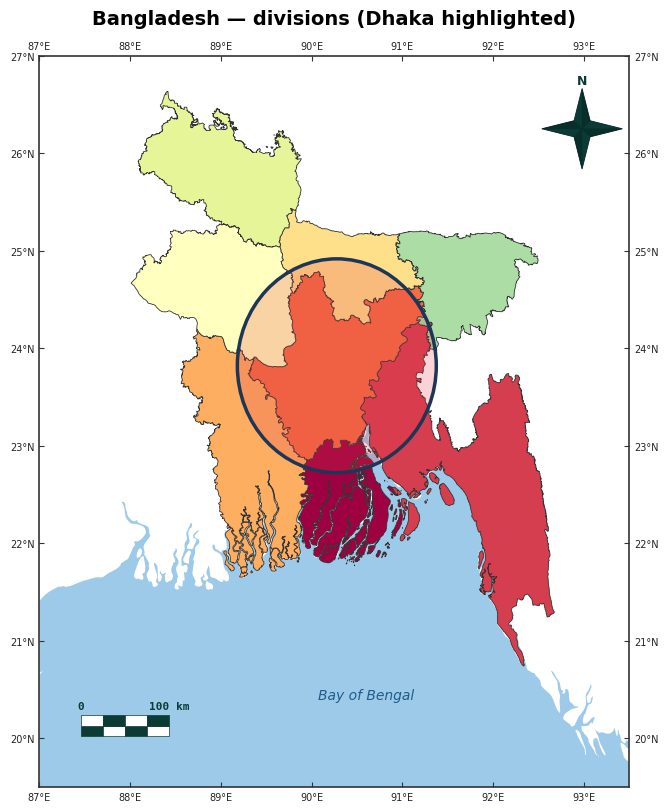
Examples and use cases
Common ways researchers use the generator:
- Study-area base maps — a district frame around field or survey sites.
- Choropleth foundations — the polygon layer your data table joins onto by name.
- Provincial context — a national map with one province highlighted for orientation.
- Cross-border figures — combine neighbours for a regional view, as in the Bangladesh–India map generator.
Because any country resolves by name, the same two lines that draw Bangladesh districts also draw Chinese provinces — only the arguments change.
import acadgis as agis
provinces = agis.load_boundaries("China", level="state")
agis.plot(provinces, highlight="Guangdong", theme="academic",
          title="Provinces of China")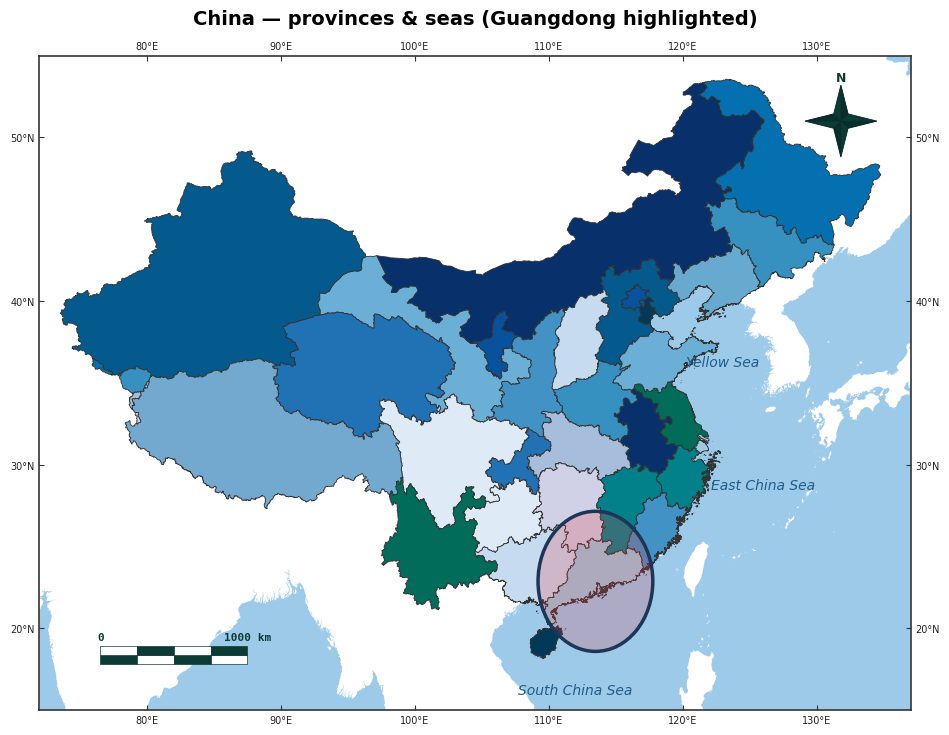
Data sources and tips
Administrative polygons come from GADM; context layers such as coastlines and seas draw on Natural Earth and, for finer detail, OpenStreetMap. A few practical tips:
- Match the level name to what you need — use division and upazila for Bangladesh's hierarchy, state and district elsewhere.
- Fetch the whole country once, then subset with within= rather than re-downloading per region.
- Export at dpi=300 with agis.save() for print-quality journal figures.
- Cite GADM (and its version) in your methods; its boundaries are widely accepted for academic mapping and disputed borders follow GADM's conventions, which you should note where relevant.
How to generate an administrative boundary map in Python
- Install and import AcadGIS. Run pip install acadgis, then start your script with import acadgis as agis.
- Fetch boundaries by name. Call agis.load_boundaries("Bangladesh", level="district") to pull the district polygons from GADM as a GeoDataFrame.
- Subset to a parent region (optional). Pass within= a parent name to get only that unit's children, e.g. load_boundaries("Bangladesh", level="upazila", within="Dhaka").
- Plot with the academic theme. Call agis.plot(gdf, theme="academic", title=..., highlight=...) to add a north arrow, scale bar, legend and optional highlight.
- Export at print quality. Save the figure with agis.save("map.png", dpi=300) for a publication-ready administrative boundary map.
Frequently asked questions
What is an administrative boundary map generator?
It is a tool that fetches official administrative boundaries — country, state, district and sub-district — by name and renders them as a styled map. AcadGIS does this in Python by pulling geometry from GADM so you never download a shapefile manually.
Where do the boundaries come from?
AcadGIS sources administrative polygons from GADM, the Database of Global Administrative Areas, and adds context layers from Natural Earth and OpenStreetMap. Boundaries are cached after first use so figures reproduce offline.
Which countries are supported?
Effectively every country, because boundaries download on demand by name. Bangladesh, Iraq, India and the USA are bundled and work fully offline without any download.
How do I get just the districts of one state or division?
Pass the parent region to the within= argument of load_boundaries(). For example, load_boundaries("Bangladesh", level="upazila", within="Dhaka") returns only that division's sub-districts.
Can I highlight a single region on the map?
Yes — pass the region name to the highlight= argument of plot(). AcadGIS shades that polygon distinctly while keeping the surrounding units as context.
Do I need to reproject or clean the shapefile first?
No. AcadGIS returns a ready-to-plot GeoDataFrame with projection and naming handled, so you go straight from load_boundaries() to plot() without GIS preprocessing.
Is AcadGIS free to use?
Yes, AcadGIS is free and open-source. Install it with pip install acadgis and use it through a single import acadgis as agis.