 Acad
AcadBangladesh & India Map Generator for Research Maps
The AcadGIS Bangladesh & India map generator ships administrative boundaries for both countries bundled inside the package, so you can plot divisions, districts and upazilas in Python without hunting for shapefiles or waiting on a download. It is built for researchers who need clean, reproducible base maps for South Asian study areas.
What a Bangladesh & India map generator is and why researchers need it
A Bangladesh & India map generator turns official administrative boundaries into figures you can drop straight into a paper, thesis or grant report. For South Asian research this is harder than it sounds: national portals, GADM exports and census files use inconsistent naming, projections and file formats, and district lines have been redrawn repeatedly as new districts were carved out.
AcadGIS solves the base-map problem by bundling the boundaries offline. Bangladesh (division, district and upazila) and India (state and district) ship inside the package, so a fresh install draws a district map of either country with no download and no desktop GIS software. That matters for reproducibility: a colleague running your script gets the exact same geometry you did, byte for byte. For the general boundary workflow across other countries, see the administrative boundary map generator.
Make a Bangladesh or India map in Python
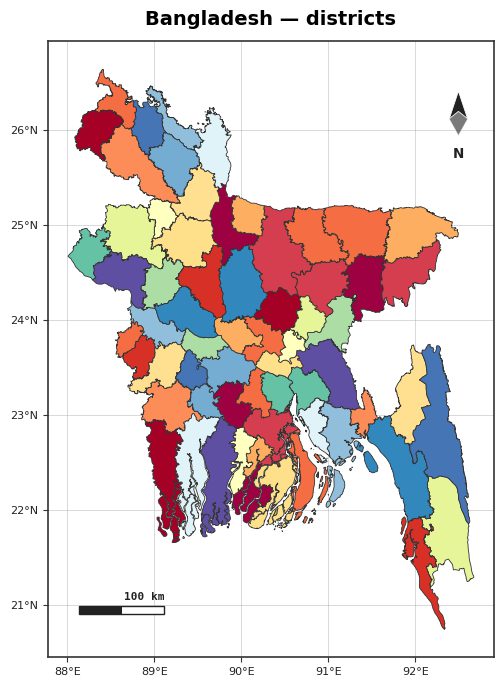
Loading and plotting is two lines. load_boundaries returns a GeoDataFrame; plot renders a clean academic figure with a north arrow and scale bar by default. The snippet below draws every district in Bangladesh, then saves a 300 DPI figure suitable for print.
import acadgis as agis
gdf = agis.load_boundaries("Bangladesh", level="district")
agis.plot(gdf, title="Bangladesh Districts", theme="academic")
agis.save("bd_districts.png", dpi=300)
Zoom from India into a single Bangladesh study area
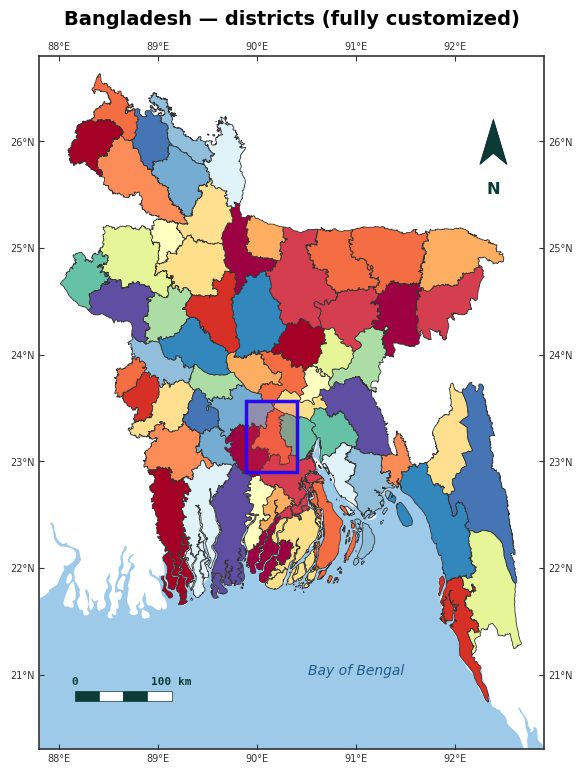
Most papers need a study-area figure that shows national context and local detail together. You can load India states for context and Bangladesh upazilas for detail from the same bundled data, or pass a parent region with within= to subset a single division. To assemble divisions and districts into a locator-style panel automatically, the study area map generator handles the cascade layout for you.
import acadgis as agis
upz = agis.load_boundaries("Bangladesh", level="upazila", within="Dhaka")
agis.plot(upz, title="Upazilas within Dhaka Division", theme="academic")
Name matching for historical and alternate spellings
The most painful part of mapping South Asian data is joining it to boundaries. Your survey may say Dacca, Jessore or Chittagong while the shapefile says Dhaka, Jashore or Chattogram; Indian data mixes Bombay/Mumbai, Calcutta/Kolkata and Pondicherry/Puducherry. AcadGIS ships a matched boundary set and applies fuzzy name matching so choropleth aligns your values to the right polygon even when spellings differ.
Pass a DataFrame or dict of values and let it match on the region-name column. Build a full thematic figure with the choropleth map generator workflow.
import acadgis as agis
gdf = agis.load_boundaries("India", level="state")
agis.choropleth(gdf, data=df, key="state", value="literacy",
                palette="viridis", title="Literacy by State")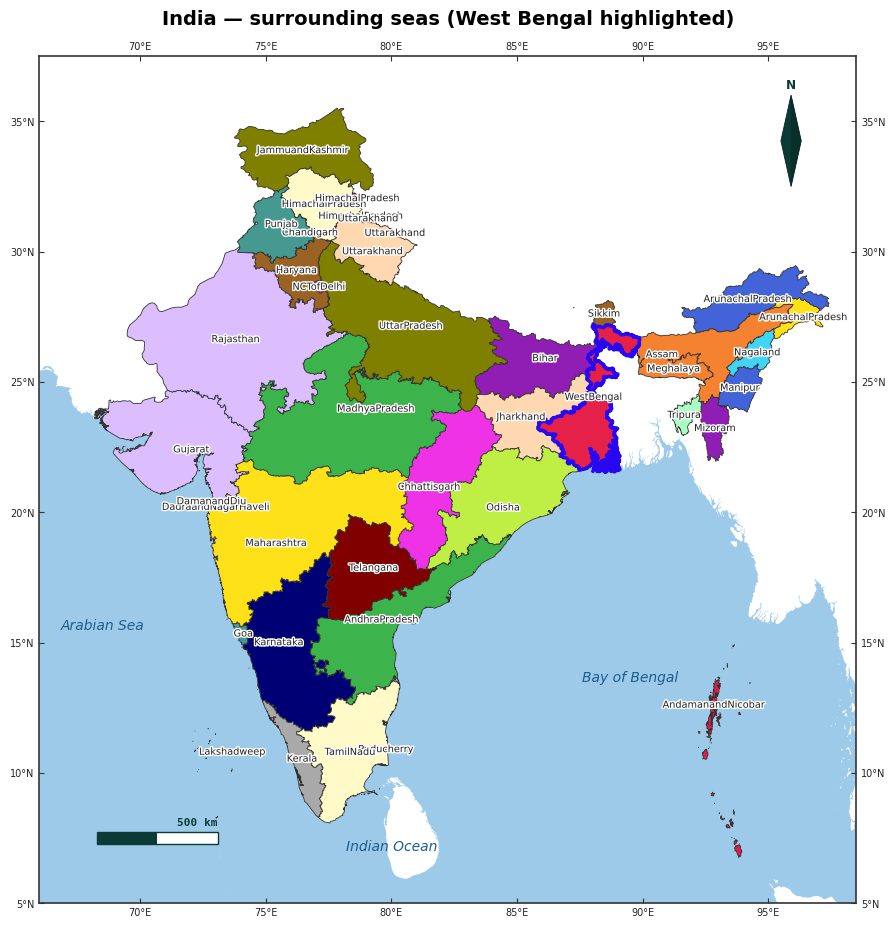
Example use cases
Researchers reach for the generator across a wide range of South Asian figures:
- Public health: district choropleths of disease incidence or vaccination coverage in Bangladesh.
- Environment: upazila study-area maps overlaid with Sentinel-2 NDVI or ESA WorldCover land cover.
- Social science: state-level literacy, poverty or census maps across India.
- Cross-border studies: a single figure spanning eastern India and Bangladesh for river-basin or migration work.
Because the base map is deterministic, every figure regenerates identically from your script, which is exactly what a reviewer expects when they ask you to reproduce a map.
Data sources and tips
Bundled boundaries are derived from GADM for administrative levels and Natural Earth for coastlines and seas. Optional overlays pull from live open sources: Sentinel-2 via Copernicus for NDVI, ESA WorldCover 10 m land cover, OpenStreetMap for roads and rivers, and the Copernicus GLO-30 DEM for terrain and hillshade.
Tips: use level="upazila" only when you truly need it, since 500+ polygons produce dense figures; add graticule=True in plot for a coordinate grid in formal reports; keep your name column clean and let choropleth handle the rest of the matching; and always export with agis.save(dpi=300) so lines stay crisp in print.
How to make a Bangladesh or India map in Python with AcadGIS
- Install and import. Run pip install acadgis, then start your script with import acadgis as agis. Bangladesh and India boundaries are bundled, so no download is needed.
- Load boundaries. Call agis.load_boundaries('Bangladesh', level='district') or level='state' for India to get a GeoDataFrame at the administrative level you need.
- Subset to a study area. Pass within='Dhaka' to load only the districts or upazilas inside a parent region, keeping the figure focused.
- Join your data. Use agis.choropleth() with your DataFrame; fuzzy name matching aligns values even for historical spellings like Dacca or Bombay.
- Style and export. Render with agis.plot(theme='academic') to get a north arrow, scale bar and legend, then agis.save('map.png', dpi=300) for print.
Frequently asked questions
Does the Bangladesh & India map generator work offline?
Yes. Boundaries for Bangladesh (division, district, upazila) and India (state, district) are bundled inside the AcadGIS pip package, so maps render with no internet connection. Only optional live overlays like satellite imagery or NDVI require a network.
What administrative levels are available?
Bangladesh ships with division, district and upazila levels, and India ships with state and district levels. You select one with the level argument of agis.load_boundaries.
How does AcadGIS handle historical or alternate place-name spellings?
It uses fuzzy name matching against a matched boundary set, so choropleth joins your data even when spellings differ. Dacca matches Dhaka, Jessore matches Jashore, and Bombay matches Mumbai automatically.
Where do the boundaries come from?
The bundled administrative boundaries are derived from GADM, with coastlines and seas from Natural Earth. This gives consistent, citable geometry across both countries.
Can I overlay satellite or land-cover data on these maps?
Yes. You can add Sentinel-2 NDVI, ESA WorldCover 10 m land cover, OpenStreetMap rivers and roads, and Copernicus GLO-30 terrain on top of the bundled boundaries using the add_ layer functions such as add_ndvi and add_landcover.
How do I make a district choropleth of Bangladesh?
Load districts with agis.load_boundaries('Bangladesh', level='district'), then pass your DataFrame to agis.choropleth() with the value column. It matches your rows to districts and renders a themed legend automatically.
Is AcadGIS free to use for this?
Yes. AcadGIS is free and open source under the Apache-2.0 license, and the Bangladesh and India boundaries are included at no cost. You install it with pip install acadgis.