 Acad
Acad
Best Python Libraries for GIS and Mapping: A Fair 2026 Comparison
The best Python libraries for GIS and mapping in 2026, compared: GeoPandas, Folium, Cartopy, Contextily, Plotly, Kepler.gl and AcadGIS, with a clear pick guide.
Guides and comparisons on making research maps in Python — plotting points, choropleths, study-area and locator maps, publication-ready figures, and the best tools for the job.
The best Python libraries for GIS and mapping in 2026, compared: GeoPandas, Folium, Cartopy, Contextily, Plotly, Kepler.gl and AcadGIS, with a clear pick guide.
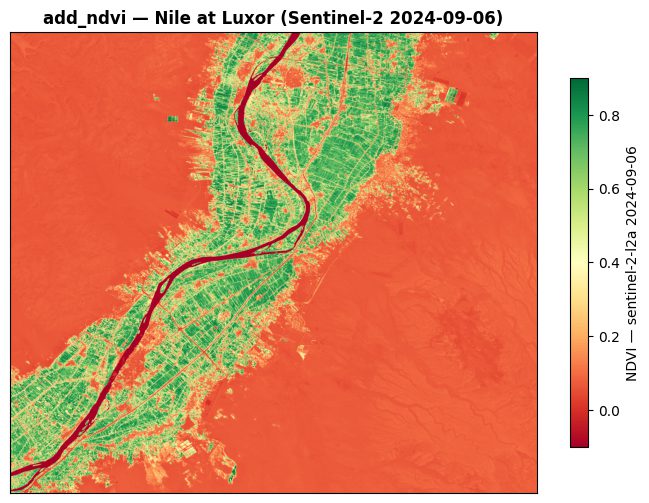
How to map Sentinel-2 NDVI in Python with no API key: fetch, compute and plot NDVI from the Earth Search STAC catalogue in a few lines with AcadGIS, plus the manual route.
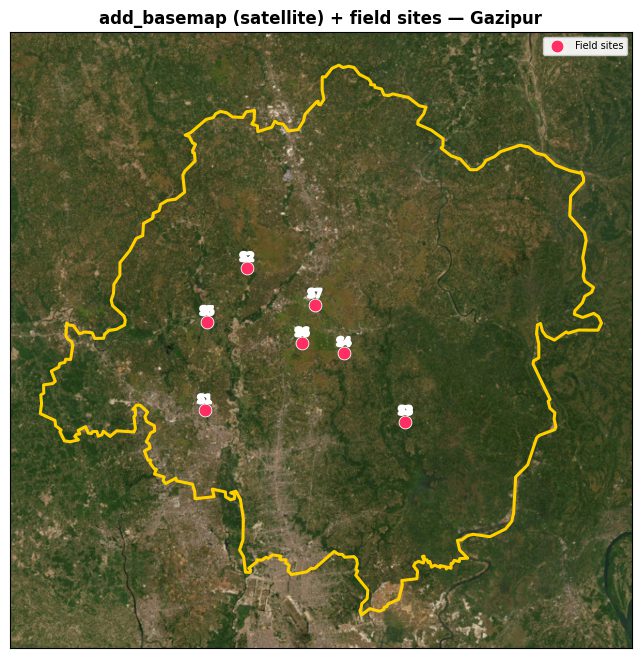
How to plot latitude and longitude points on a map in Python: read a CSV, compare folium, plotly, geopandas and AcadGIS, and build a publication-ready point map.
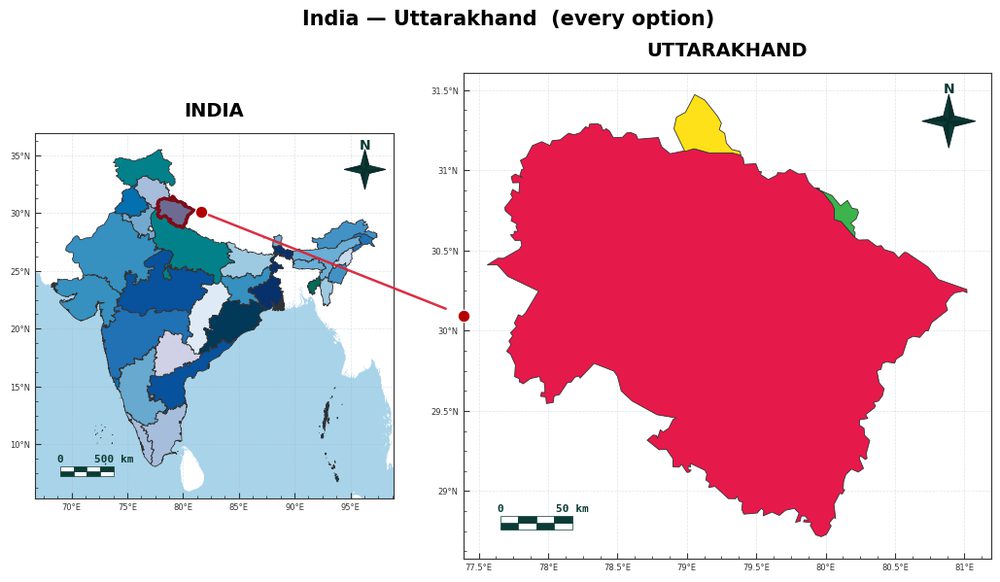
How to add a north arrow, scale bar and graticule to a Python map: the honest matplotlib and geopandas way, the projection rule, plus a one-line AcadGIS shortcut.
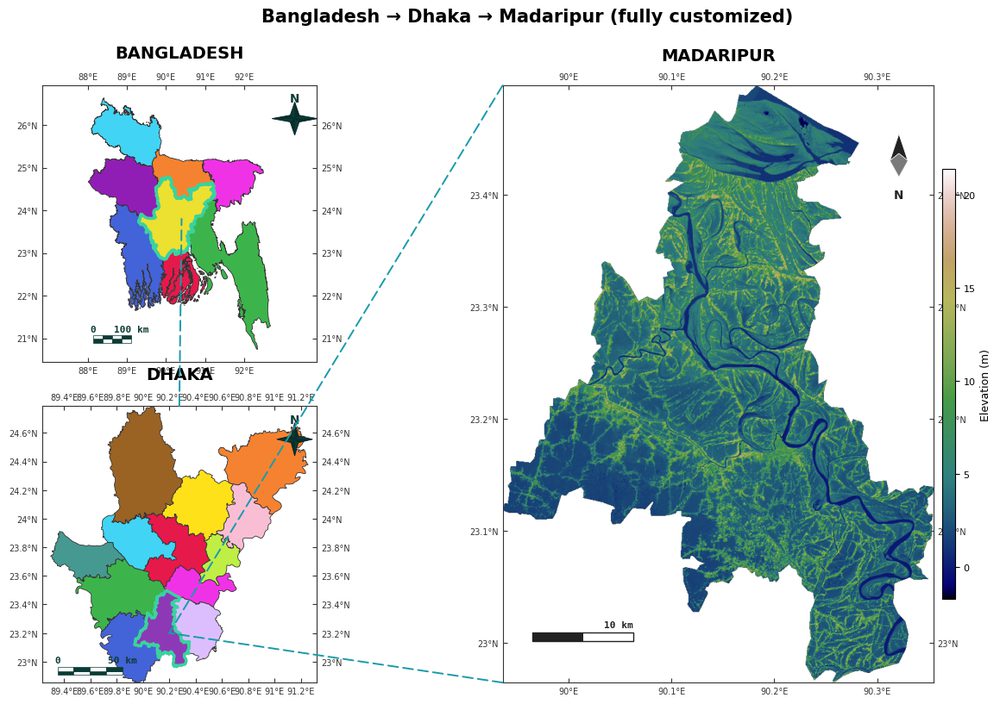
Free QGIS and ArcGIS alternatives for researchers, compared on cost, learning curve, reproducibility and print-quality output, with a fast, code-driven pick.
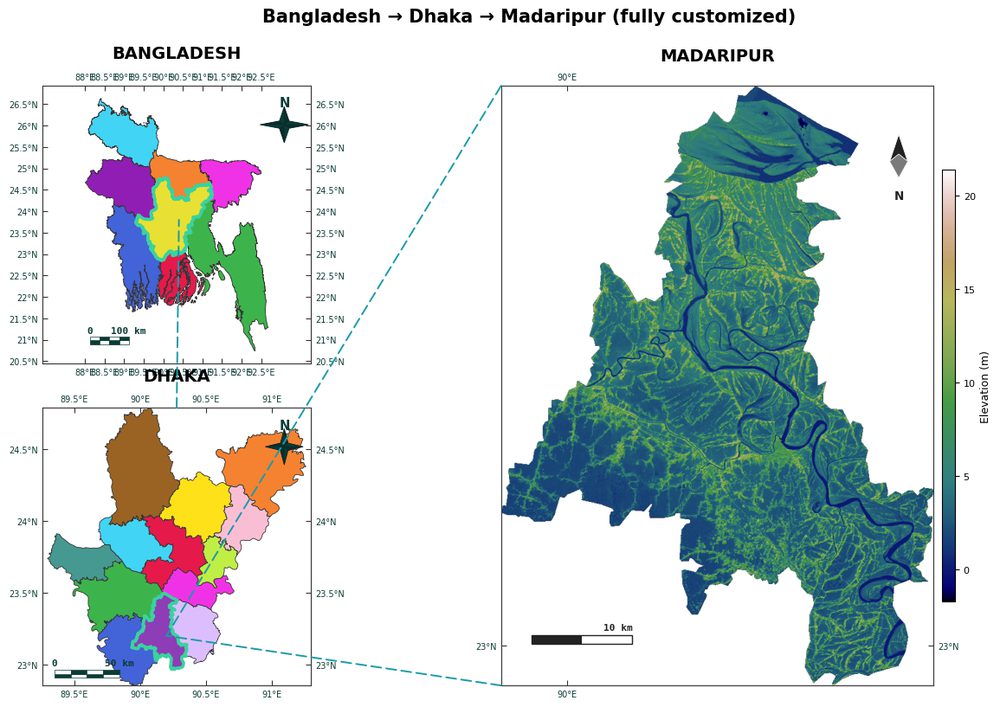
How to make a publication-quality map for a research paper: journal DPI, format, and color specs, a map-element checklist, honest tool comparison, and Python code.
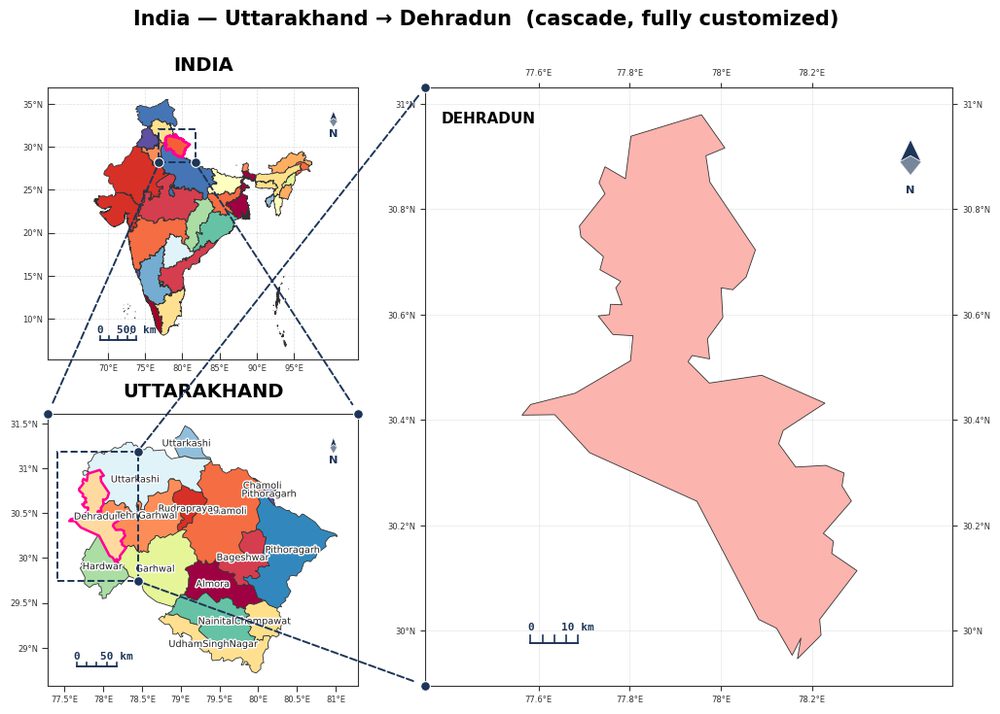
What is a locator map? Learn how this small inset orients readers, when to use one, how it differs from study-area maps, and how to make one in Python.
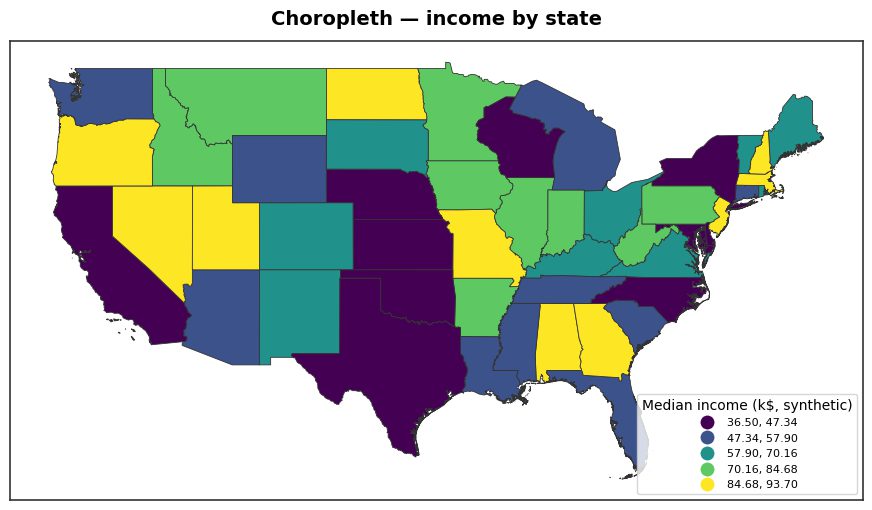
How to make a choropleth map in Python: join a CSV to admin boundaries by name, survive the Comilla-vs-Cumilla matching pain, and pick a classification scheme.
How to make a study area map for your thesis or paper: nest your site in its region and country, then add a north arrow, scale bar, and graticule in Python.