 Acad
AcadWorld Map Country Highlighter for Research Figures
A world map country highlighter marks a single country on a clean global basemap so readers instantly see where your study sits. AcadGIS builds one in a few lines of Python, adds a zoomed locator panel, and greys out labelled neighbours — all offline.
What is a world map country highlighter and why researchers need it
A world map country highlighter is a small reference figure that colours one country on a clean, neutral world map so readers immediately grasp where a study takes place. It is the first map in countless papers, theses and grant proposals — the "you are here" panel that anchors everything that follows.
Researchers need it because reviewers should never have to guess the location of the work. A highlighted country removes ambiguity, works across every discipline, and reproduces cleanly in black-and-white print where colour is unavailable. The strongest versions go one step further: they grey and label neighbouring countries for context and pair the global view with a zoomed locator panel, so a single figure carries both continental and national scale.
Make a world map country highlighter in Python with AcadGIS
The fastest path is to load the bundled world layer and highlight a country by name. AcadGIS handles the projection, the neutral fill and the highlight colour, so the output is publication-ready from the first run.
The snippet below produces a clean world map with Japan picked out. Because the world boundaries are bundled, it runs with no internet connection.
import acadgis as agis
world = agis.load_world()
ax = agis.plot(world, theme="academic", title="Study country: Japan")
agis.highlight_country(ax, "Japan")
agis.save("japan_world.png", dpi=300)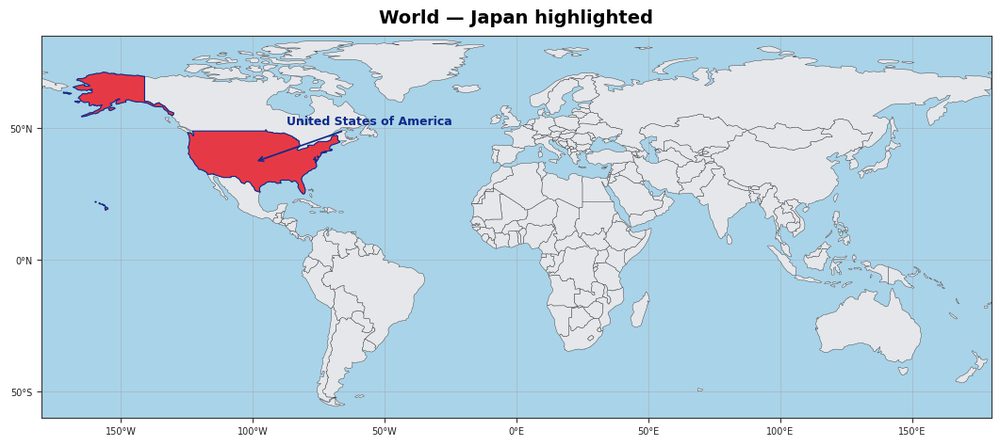
Add a zoomed locator panel beside the global view
A world highlight tells readers which country; a zoomed panel shows them what it looks like. AcadGIS builds both in one figure, so you never stitch images together in an editor. Use StudyArea to set the country context and zoom into a region, or reach for the dedicated study area map generator workflow when you need cascading detail levels.
The code below produces a two-panel figure — the country in context on one side and a zoomed administrative view on the other — with a north arrow and scale bar added automatically.
import acadgis as agis
fig = (agis.StudyArea("United Kingdom", context_level="country")
           .zoom_into("Greater London", detail_level="district")
           .figure(suptitle="United Kingdom — Greater London"))
agis.save("uk_locator.png", dpi=300)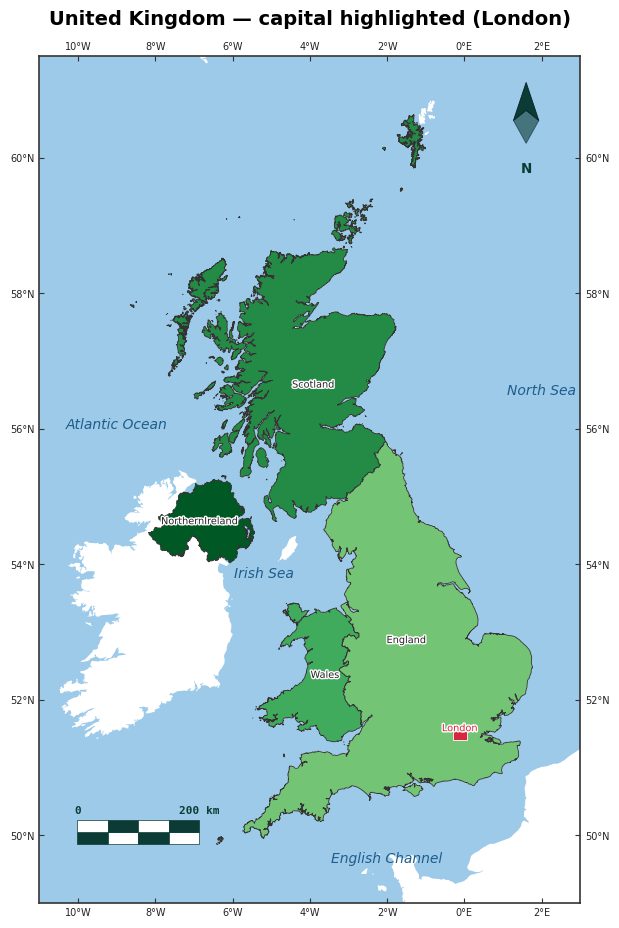
Grey and label neighbours for context
A country floating alone on a blank map can be hard to place. Rendering neighbours as a muted base layer fixes this: it keeps the highlight dominant while giving readers familiar reference points around it. In AcadGIS you plot the wider world first, then pass highlight= to plot() so the study country reads first.
This treatment is especially useful for regional work where borders matter, such as transboundary river basins or shared administrative frontiers. If your study spans two nations, the Bangladesh–India map generator applies the same greyed-neighbour approach to a specific cross-border pair.
import acadgis as agis
world = agis.load_world()
ax = agis.plot(world, theme="academic", highlight="France",
               title="France in context", border="grey")
agis.save("france_context.png", dpi=300)
Use cases and examples
The highlighter appears wherever a figure needs geographic grounding:
- Paper and thesis openers — the location figure that precedes any detailed study-area map.
- Grant and report cover maps — a clean single-country highlight that reads at a glance.
- Comparative studies — highlight several countries in sequence to structure a cross-national argument.
- Teaching and slides — a neutral world basemap with one country picked out, legible on a projector.
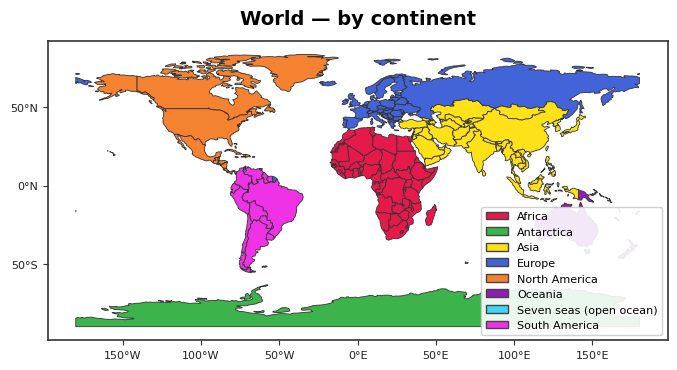
Because the same plot() call also colours maps by attribute, you can move from a simple highlight to a world map coloured by continent or another thematic field without switching tools.
Data sources and offline behaviour
AcadGIS draws the world layer from Natural Earth, the standard free vector basemap for cartography, and pulls country and administrative boundaries from GADM, the global database of administrative areas widely accepted in academic publishing. Both are free to use in papers and theses.
The world map plus Bangladesh, Iraq, India and the USA ship bundled with the package, so a country highlighter runs with no internet connection. Any other country downloads by name the first time you request it, then is cached locally for offline reuse. That makes the tool reliable on field laptops, air-gapped machines and during conference travel.
How to highlight a country on a world map with AcadGIS
- Install and import. Run pip install acadgis, then start your script with import acadgis as agis.
- Load the world layer. Call world = agis.load_world() to load the bundled Natural Earth world boundaries, which work offline.
- Plot a clean basemap. Create the figure with ax = agis.plot(world, theme="academic", title="Study country") for a neutral, publication-ready base.
- Highlight the country. Colour your country with agis.highlight_country(ax, "Japan") while every neighbour stays neutral.
- Add a locator panel. For a two-scale figure, use agis.StudyArea(country).zoom_into(region).figure() to attach a zoomed administrative panel.
- Export at print resolution. Save the figure with agis.save("map.png", dpi=300) for papers, theses and reports.
Frequently asked questions
What is a world map country highlighter?
A world map country highlighter is a figure that colours one country on a clean world basemap while leaving the rest of the world neutral, so readers instantly see where a study is located. It is the standard location panel placed at the start of papers, theses and grant proposals.
How do I highlight a country on a world map in Python?
Load the bundled world layer with agis.load_world(), plot it, then call agis.highlight_country(ax, "Japan") to colour your chosen country. The whole workflow is four lines starting from import acadgis as agis, and it produces a print-ready figure at 300 dpi.
Does the AcadGIS country highlighter work offline?
Yes, the world layer plus Bangladesh, Iraq, India and the USA ship bundled with AcadGIS, so highlighting those runs with no internet connection. Any other country downloads by name on first use and is then cached locally for offline reuse.
Can I add a zoomed locator panel beside the world map?
Yes, use agis.StudyArea(country).zoom_into(region).figure() to build a single figure with both the country context and a zoomed administrative view. A north arrow and scale bar are added automatically to the panels.
Can I grey out and label neighbouring countries?
Yes, plot the neighbours as a muted base layer and pass highlight= to plot() so your study country stays dominant while surrounding nations provide reference points. This keeps the highlight legible even in black-and-white print.
Which data sources does AcadGIS use for the boundaries?
The world layer comes from Natural Earth and country or administrative boundaries come from GADM. Both are free vector datasets accepted for academic publication, so figures can be reused in journals and theses without licensing fees.
Is AcadGIS free to use for making highlighted world maps?
Yes, AcadGIS is free and open-source and installs with pip install acadgis. There are no per-map costs or subscriptions for producing world map country highlighter figures.